

Maintaining a good user experience while delivering quality content, and paying for it

Page performance has been cited as a reason to install an ad-blocker. In fact, a recent straw poll suggests that 71% of ad-blocker users would whitelist a publisher website if the page performance didn’t suffer. Blocking ads, which can be half of the content of a web page, will almost certainly improve the page performance. Mozilla Firefox even has a “reader view” available for many pages that removes all the content except the main body copy. That feature goes as far beyond ad blocking as you can get.
The four things that slow down page performance are:
- the number of requests the browser is making
- the time it takes for a response
- the payload associated with each request
- the code executed on the page once the request is fulfilled
In many cases the executed code will make additional requests and the dance starts all over again. This process takes a toll on page performance and each browser responds a little differently to the tasks. The browser may appear sluggish or unresponsive while the page elements are loading, executing or rendering. It may present the loading icon in the tab, which itself can freeze.
Browser Limits
Most desktop web browsers limit the number of concurrent connections to a single host. This feature is supposed to optimize the TCP/IP stack. If you were able to open hundreds of connections to a your computer would spend most of its resources managing those connections. As a result, web browsers set limits on the number of connections they make at any given time. These are set at six or eight per domain, and a bit more overall.
Knowing the domain limit is very helpful in optimizing a page for a quick download. Counting the number of elements on the page that are sourced from a single domain host will let you know if the browsers is going to hit the limit. Once a browser reaches the limit, it waits for one of the existing connections to close before it opens a new one. This has the effect of making the user wait.
The limit on the number of overall connections is not much more generous than it is for a single domain. In Firefox, for example, this limit is set to 256 in theory, in practice it doesn’t maintain more than 17 concurrent connections. That means that if there are more than 17 elements on a page the browser will, again, wait for some content to finish downloading before it will open a new connection. Mobile browsers, such as iOS Safari, also have limits around 17. Browsers can be tested at Browserscope.org.
Page Performance Tools
Fortunately there are tools built into most browsers, online, or available via a plugin to gain insight into what sources are causing sluggish code execution, download times, heavy downloads, multiple simultaneous connections, and, generally, poor page performance.
App Telemetry
A plugin called App Telemetry can give you high-level insight into what is slowing down the page load. Most of the time this plugin will highlight TCP requests and (code) Processing as the laggards. Examining these two elements requires the user of a browser developer’s console that is usually built in to the browsers.
Ghostery Enterprise
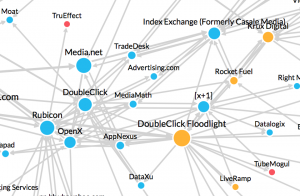
Bridging the gap between plugins and services is Ghostery with their enterprise tracking service. This tool allows you to see the chain of events that results in an asset’s presence on the page. It also imparts the domain’s payload size with the relative circle size. They don’t appear to offer a freemium service, but they let you play with the New York Times’ data at app.ghosteryenterprise.com.
Google PageSpeed Insights
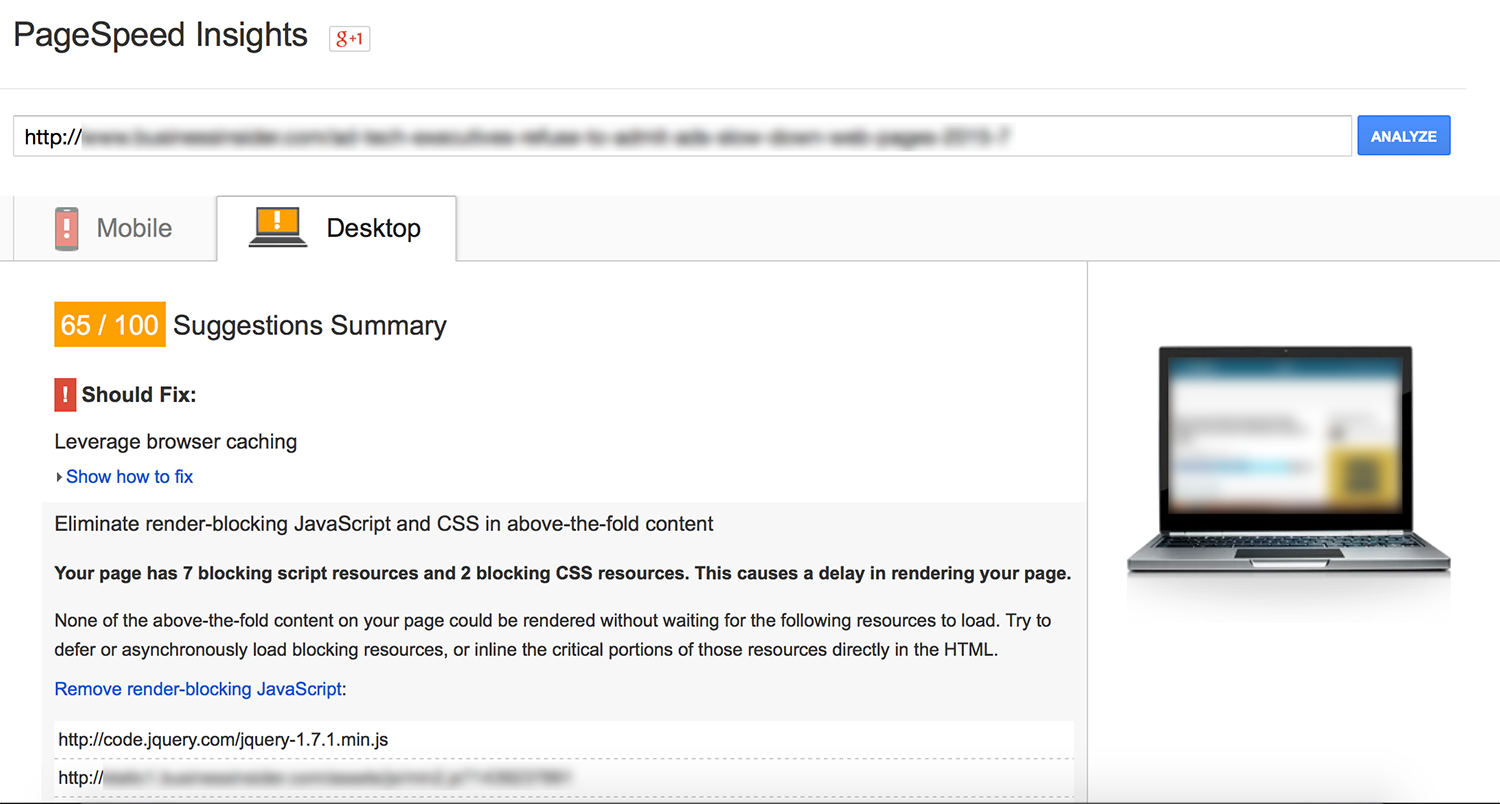
Google kindly put a very handy tool out there called Page Speed. It can generate an insights report that will identify, for example, which elements on the page are blocking the page render. This will help publishers identify which technology providers they need to work with in order to fix page performance issues.
WebPageTest
Hosted at the humble webpagetest.org, this tool gives you a report card for the initial load of the page as well as subsequent loads. It can provide hints on browser caching, image compression and will even tell you the cost for someone to download it on their mobile device.
New Relic APM
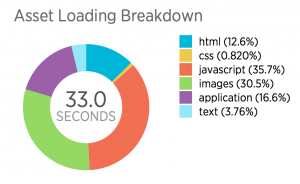
The APM monitoring service, newrelic.com/application-monitoring, breaks down your page assets and calls out the slow performing domains. New Relic offers a free test, as well as an enterprise grade monitoring solution.
In-Browser Developer Consoles
In the console there is usually a tab called Network (or Timelines in Safari). It exposes each request the browser is making to load the page. There can be as few as a dozen to as many as 500 or more, depending on how the site is built and how many 1st and 3rd party technology contributions are being made on the page. Examining the requests can reveal how long each request is taking, how large the payload is, and whether or not the request is synchronous or asynchronous (serialized or happening in parallel).
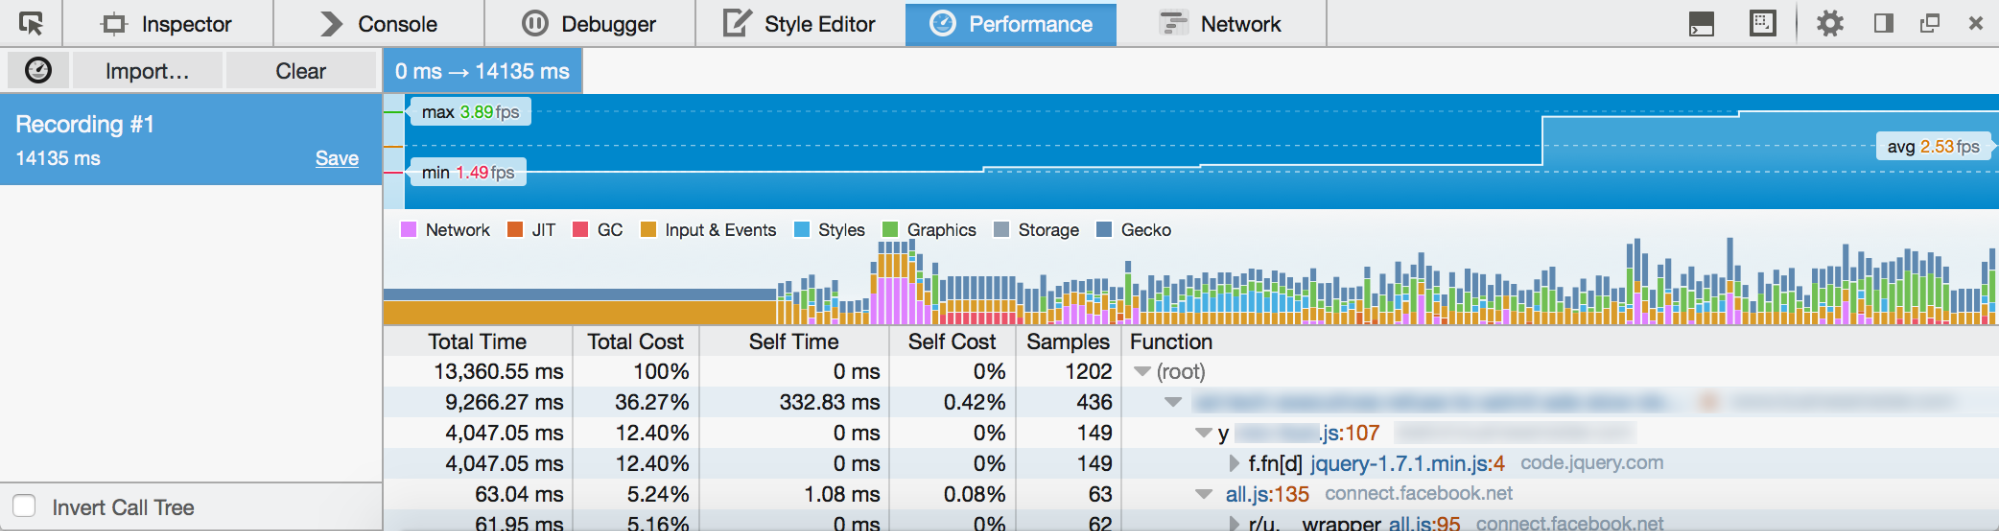
Another tab in the console will either be called Performance, Timeline or be a subset of Timeline (Safari). This tool can be used to determine which elements are simply taking up the browser’s time (resources). Script executions are tracked and broken down. Digging through this tool reveals which page elements are costing CPU cycles and probably hampering page performance. Some browsers allow you to export a .har file whic
h can be loaded into third party apps, like the har viewer from softwareishard.com, Har Analyzer from Google, or custom built scripts for further analysis. Having a .har file in hand also lets you pass performance data around.
Other Page Performance Tools
There are other tools out there when you decide to put money toward page performance: Catchpoint, Web Bloat Score and Clarity Ads to name just a few. These will analyze and score or monitor aspects of page performance and some will go so far as to send out an alert if there are issues.
Next Steps
These tools are generally geared toward desktop based pages, but they get you thinking in the right way for mobile and other platforms as well. Work with your ad tech vendors to streamline the load speed. Isolate technologies to figure out which browsers perform appropriately and which are delivering a poor experience. Experiment to see how page performance impacts social media shares, user sessions and overall revenue.
If your organization is focused on revenue per day, consider looking at the lifetime user value (LTV) as a new key metric. Page performance becomes hugely important in light of this metric as it puts the user’s experience front and center. And being mindful of the user’s experience with your brand will increase loyalty, page shares, and the amount of time a user spends on your site.