Banner Ad: Please Fix Your Pacing Algorithm
Decorative Header Image

Search results for pacing

Pacing Algorithm for Advertising Campaigns and Inventory Allocations

I was trying to figure out what to do with my Sunday. My options were: build a little header bidding ad server plugin for WordPress; run, sleep and eat; or write up some blog post on a pacing algorithm, because people still seem to be producing crappy ones. Since you’re reading this, you can probably guess which choice I made. I mean, it’s not the first post I’ve written on the subject.

It showed up again last week. I didn’t expect it, but I guess I never do. A saw-tooth pattern on a chart, indicative of a capping of sorts. A chart that says, “I want a thing to happen, but only so much.” In this case it was a traffic allocation. This was a surprise.

A little (bad pacing algorithm) history

Most of the time when I run into a bad pacing algorithm it’s in the form of a campaign trying to limit itself. It only needs to acquire a few thousand impressions every five minutes, for example. So the hastily written algorithm might divvy up the impression allocation into five minutes buckets. Effectively that’s 12 buckets every hour. So it takes an hour’s worth of impression needs and divides it by twelve. One twelfth of the impressions are purchased every five minutes. Unfortunately at that point it switches to a simple counter that says, “for the next five minutes buy impressions until the number purchased reaches 1/12th of what I need in this hour.”

You end up with a purchase graph that looks like this.
Sawtooth Pattern exposes a bad pacing algorithm

See that blue spiky thing? That’s the one that’ll get ya. Read on to find out how this impacts the industry and how to fix it

Audience Forecasting and Campaign Pacing

Audience Forecasting and Campaign Pacing“In online advertising, how can I predict/forecast the traffic (number of requests) for a day ?
For a given day, I would like to get the estimated number of eligible impressions a campaign will have, in order to allocate my budget and implement a traffic based pacing algorithm.”
This question was asked on Quora, below is my answer.

The estimated number of eligible impressions, or audience forecasting or “avails” as they say in the industry, can be derived in several ways. I will illustrate two of the methods.

The long, but easy method

The easiest way to estimate your avails would be to just take a whole day’s worth of data and determine how many of your target users are in there. The problem with this method is that it can take a whole day. If you have a day to spare, this is a good way to go.

The short, but difficult method

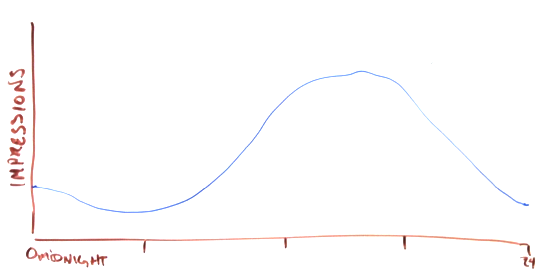
For this to work you’ll need the total traffic available for some previous day, or week. You’ll want that data broken down by hour or maybe 15 minute interval. With more traffic, your breakdown can be smaller. For the sake of this example let’s look at an hourly breakdown and a single day’s worth of data. Read more

Using Proportional Control for Better Campaign Pacing

My post was originally published on the Rubicon Project blog. It was written with contributions from Dr. Neal Richter and Jonathan Zhuang.

Pacing algorithms come in a few basic forms at the Rubicon Project. The most basic is one called “as fast as possible” which can hardly be shown to do anything that resembles pacing. The Pacing controller is supposed to spread out impressions served for a campaign throughout the day. In general it takes the goal of impressions to serve in a given day as input and calculates a serving schedule for the campaign.

Estimated Curve of Available Impressions

A naive pacing algorithm will break the day up into 24 segments, let’s call them hours. It will allocate equal amounts of campaign impression for each hour and then recommend the campaign get impressions until the hour’s allocation is exhausted. This algorithm has a couple of pretty big flaws. Primarily it tends to serve the campaigns at the beginning of each hour and then once the allocated impressions are used up it stops serving until the next hour. The second flaw is that it has no understanding of the traffic distribution throughout the day. The 1AM hour doesn’t have the same amount of traffic coming in as the 10AM hour. If the inventory is relatively scarce the campaign will under-serve during the early hours, catch up during the peak hours, and then under-serve again in the later hours. Ultimately campaigns using this algorithm may not achieve their goals at the end of the day and it won’t serve evenly in a given hour. Read more

Abridged Identity

This article was originally posted on Advertising Week. Be sure to pop over there when you’re done and catch up on identity, privacy, and the latest industry news.

A bridge in Scotland to illustrate how one identity can be used on two different devices or client browsers

What can playfully be described as a kerfuffle around how DSP IDs are being derived in the bidstream, the recent discord at the IAB Tech Lab has exposed not only shortcomings in the RTB protocol, but also a functional deficit in the programmatic ecosystem.

At the heart of the debate is the issue of how some SSPs and publishers are using probabilistic methods to apply DSP user IDs to requests from browsers that do not have 3rd party cookies enabled. Historically, DSP IDs have only been pinned to a cookie. Any bridging of IDs from a cookie-enabled browser to another browser, no matter how reliable the methodology, is not in-line with many DSP expectations. A shorthand term for this activity could be ID-Bridging. This is not the worst form of the practice. And it can grant a publisher additional coverage of DSP IDs, resulting in more revenue, but can result in some blowback when the DSPs realize that the user’s browser doesn’t actually have their cookie.

Read more

Is it Fraud? Illustrating some marginal to bad practices in ad-tech

A couple weeks ago I was looking over geographic location data to inform the return on investment of an advertising campaign. A significant portion of metropolitan data was showing a large percentage of the users sitting in the exact same location. It was as if they all checked-in on their apps while they were standing at the center of the city. That seemed unlikely. Was there something wrong with the data? Well, yes and no. More importantly: was it fraud?

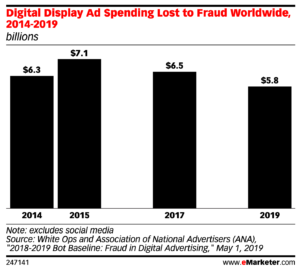
Was it fraud? Welcome to the gray area of ad-tech. eMarketer shows that display advertising fraud loss is hovering around $6 billion worldwide. They likely derived this data from very black and white definitions of what is and what isn’t fraud. In this post I’ll be lining up not only explicitly fraudulent behavior, but also some marginal tactics of media owners, supply side companies, advertisers and demand side companies to illuminate the fringes of acceptable behavior.

Read on for geo stuffing, bid caching and more…